Research has long suggested women are safer drivers than men, with lower rates of risk-taking and drink driving and fewer deaths on the road. NSW data continues to show a gender split in road trauma, but it raises a practical question for drivers: if outcomes and behaviour differ, does the CTP green slip price move too?
Men are still overrepresented in deaths and serious injuries
Women make up just over half the NSW population (50.3%) and 45.4% of driver licence holders, yet men are far more likely to die on the roads. In the year to May 2025, 78% of road deaths were male (76% is the three-year average). In the same period, 80% of driver deaths were male, while 52% were female drivers. Motorcyclists accounted for 23% of deaths, and because 95% of motorcyclists are men, that category is overwhelmingly male.
Serious injuries show a similar pattern. In the year to September 2024, 10,695 people were seriously injured on NSW roads and just over two thirds (67%) were men. Motorcyclists made up 28% of serious injuries, up from 26% the year before. Overall, men are more likely than women to die or be seriously injured, while women are more likely to be seriously injured than killed. Minor injuries are about as common for women as for men.
Age also shapes road trauma. In the year to April 2024, men made up 80% of deaths among 17–25 year olds. For both sexes, the age group with the most deaths or injuries was 40–64, followed by 26–39. Risk isn’t confined to younger drivers: four fifths of 45–60 year olds were found to be “overconfident” about their driving skills, and a study of drivers over 65 found men were still engaging in risky driving.
Exposure, confidence and risk-taking help explain the gap
One reason men may be involved in more crashes is that they often spend more time driving. Budget Direct’s 2023 commuting survey found men and women were equally likely to drive to work every day (61%) and equally likely to work from home sometimes (38%). Where it differed was commute length: women were more likely to do short trips of 0–15 minutes, while more men reported commutes of 45–60 minutes. Other research links longer commutes with male-dominated jobs such as machinery operators and drivers, technicians and tradespeople, often travelling from outer suburbs. When you seek a green slip quote, you’re asked how far you drive each year, and distance travelled can affect the price.
But kilometres don’t explain everything. A large European 2018 study found the key difference was risk-taking: even once men’s higher driving distances were considered, women were less likely to take risks and less likely to break traffic rules regardless of how far they drove. Confidence appears to be part of the picture. Around three quarters of men believe they are better than the average driver, while only 1% rated themselves as “bad” and 22% said they were average.
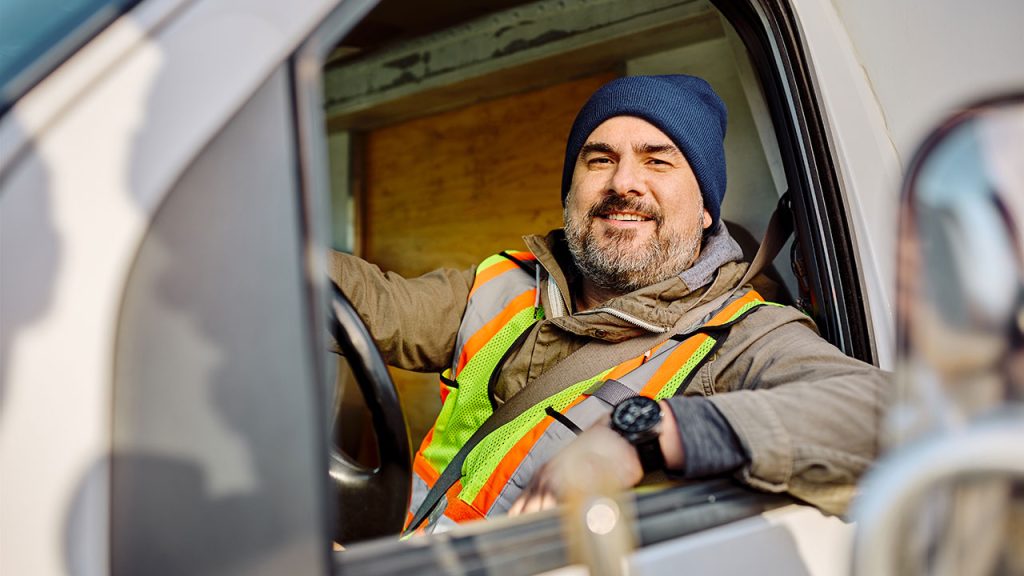
Culture can reinforce risk-taking and overconfidence behind the wheel. Masculinity is often associated with fast, powerful cars, large utes and 4WDs, and heavy vehicles. In one survey, when men were asked if they thought they could drive a semi-trailer if they had to, 44% said yes, suggesting some drivers may overestimate their capability with high-stakes vehicles.
Stress may also amplify gender differences. Women tend to anticipate negative outcomes and feel less pleasure in taking risks. These differences can increase under stress: male risk-taking tends to increase under stress, while female risk-taking tends to decrease under stress.
Distraction, drink driving and what insurance does with gender
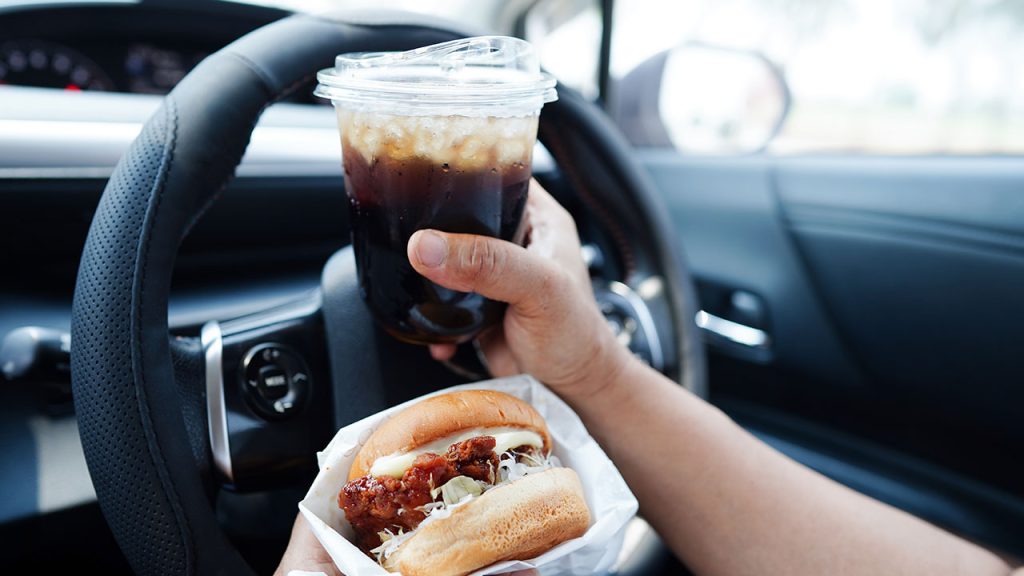
Distraction affects both men and women, although it can look different. Men are more likely to overestimate how much control they have in situations influenced by chance. In one comparison, 15% of men compared with 9.4% of women were comfortable using a phone while driving. Women, however, may be more likely to reach back to deal with children or put on make-up while driving. Distraction is hard to measure as a direct cause of serious injuries or deaths, but anything that pulls attention away from driving increases risk.
Drink driving is another area where men usually dominate, but the data includes a sharp exception: half of regional women aged 16–25 reported drink driving in the previous six months, the highest self-reported rate among all men and women. In NSW fatal drink driving crashes, 70% occurred in country regions. Drivers aged 17–24 made up one third of drink drivers in fatal crashes despite being only about one seventh of all drivers. Most drink drivers in fatal crashes were male (90%).
Budget Direct’s questions also showed differences in behaviour and beliefs. For “Have you ever driven knowing you might be over the limit?”, 17.7% of men said yes compared with 10.6% of women. For “Were there any passengers in the car at the time?”, 52.9% of men said yes and 56.4% of women said yes. For “Do you know the exact amount of drinks you can have?”, 59% of men said yes compared with 45.8% of women. For “Does exercise reduce your alcohol level?”, 20.8% of men said yes compared with 11.4% of women.
Gender can also affect comprehensive car insurance pricing. Under the Sex Discrimination Act 1984, insurers can use gender when setting premiums, although claims history still matters. Younger men are typically priced higher based on claims patterns: young male drivers under 25 average $3,020, drivers aged 25–29 average $2,176, and drivers aged 30–49 average $1,607. Men also accounted for 54% of AAMI claims over the past decade, while women made 52% of claims for minor injuries.
What it means for NSW green slips
CTP green slips in NSW don’t charge different prices based on gender. As at 1 August 2025, men and women paid the same for a green slip when vehicle information and driving history were the same. greenslips.com.au compared a 45-year-old man and woman, both “good” and “bad” drivers, in a Toyota Hilux or Mazda CX-5, where a “bad” driver meant having one or more demerit points. They found no evidence that gender changed green slip prices.
Women can still appear more often in CTP claiming data. The typical green slip claimant is female (54%), and the most common claimant age group is 25–39 (30% of all claims). In Queensland, in the decade to 2024, women made 51.6% of all CTP claims, with more claims than men in nearly all age groups.
Green slip pricing involves far more than gender, with factors like vehicle type, driving record, where you drive and how far you travel influencing the final cost.